Ⅰ. Problem Background
In photovoltaic power stations, containerized step-up transformers (referred to as "PV transformers") account for approximately 8%–12% of total equipment investment, while their losses exceed 15% of the station's total losses. Traditional selection methods often overlook lifecycle cost (LCC), resulting in hidden economic losses.
Ⅱ. Core Economic Challenges
High Initial Costs
Significant price premiums for high-end imported equipment; domestic alternatives remain under-optimized.
Excessive No-load/Load Losses
Annual energy losses from inefficient transformers can reach 0.5%–1.2% of total power generation.
Uncontrollable Maintenance Costs
Frequent failures lead to downtime losses; repair costs double in remote areas.
Low Capacity Utilization
Over-engineering causes prolonged light-load operation and reduced efficiency.
Ⅲ. Economic Optimization Solutions
Precision Sizing Strategy: Avoiding Capacity Redundancy
Dynamic Capacity Matching Model
Uses local irradiance data + DC-to-AC ratio (typically 1.1–1.3) to calculate optimal transformer load rate (recommended 75%–85%).
Case: A 100MW plant replaced 160MVA conventional transformers with 120MVA PV-dedicated units, reducing initial investment by ¥2.2M while maintaining load losses.
Voltage Level Optimization
Using 35kV (vs. 33kV) for medium voltage lowers cable costs by 7%–10% and reduces procurement costs for domestic equipment.
Loss Control Technology: Core of Lifecycle Cost Reduction
Low-Loss Materials
Amorphous-core transformers cut no-load losses by 60%–80%. Despite 15%–20% higher upfront cost, ROI achieved in 3–5 years (calculated at ¥0.4/kWh).
Smart Capacity Adjustment
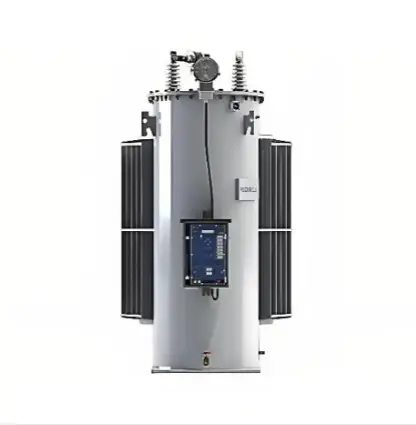
On-load tap changers (OLTC) enable low-capacity mode during low-irradiance periods, reducing no-load losses by >40%.
Localization and Standardization Synergy
Domestic Core Component Substitution
Adopting domestically produced nanocrystalline strips (30% cheaper than Hitachi Metals) and epoxy resin casting systems.
Modular Design
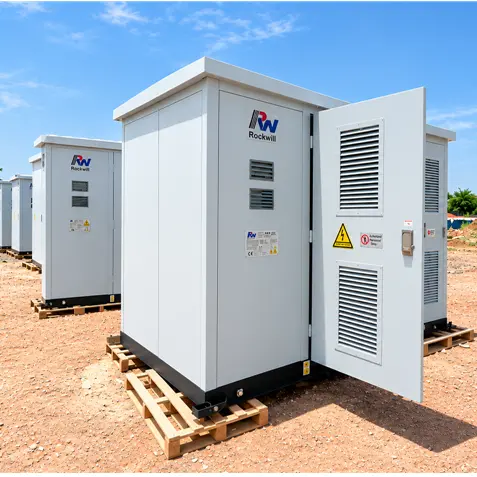
Prefabricated smart PV substations (integrated transformers, ring main units, monitoring systems) cut on-site installation costs by 20% and shorten timelines by 15 days.
Smart O&M System: Reducing Hidden Costs
IoT Monitoring Terminals
Real-time tracking of oil temperature, partial discharge, and core grounding currents optimizes maintenance cycles, reducing unexpected downtime.
Data: Smart diagnostics increase MTBF to 12 years and lower O&M costs by 35%.
Grid Demand Response Participation
Adjusting transformer taps for voltage support generates grid ancillary service revenue (¥30–80/MW per event).
Financial Leverage Applications
Green Finance Instruments
Utilize low-cost green loans (10%–15% below benchmark rates) for efficient equipment procurement.
Energy Performance Contracting (EPC)
Suppliers guarantee efficiency thresholds, compensating for electricity cost gaps if unmet.
Ⅳ. Economic Quantification (100MW Plant Case)
Item
Conventional Solution
Optimized Solution
Annual Benefit
Initial Investment
¥2M
¥9.8M
Save ¥2.2M
No-load Losses
45kW
18kW (amorphous core)
Save ¥230k/yr
Load Losses (75% load)
210kW
190kW (copper foil winding)
Save ¥160k/yr
O&M Costs
¥500k/yr
¥320k/yr
Save ¥180k/yr
Payback Period
—
2.8 years
>22% IRR